


The Rise of Global Startup Investors
Recently, Brad Feld and I have been working hard on The Startup Community Way, a book on how to harness the complexity in the entrepreneurial age. It’s a follow-up to Brad’s, 2012 classic: Startup Communities. We completed a chapter that documents the growth of startup activity globally over the last decade—from startup deals to investors to startup programs—but recently decided to scrap it from the book. But, we wanted to put those data points to use, so I’ll publish some of them here.
(Note: if you want a comprehensive look at trends of venture deals, see Rise of the Global Startup City: The New Map of Entrepreneurship and Venture Capital, a report I published last September with my friend and colleague Richard Florida. It covers a decade of venture capital deals across more than 300 global metropolitan areas that span 60 countries.)
Here, I’ll document the rise of three types of investor groups: venture capital firms (from Seed through later-stage VC), corporate venture capital groups, and a third group for accelerators and incubators. These groups have been pre-populated by PitchBook, my source in this analysis.
I tabulated the active universe of these three investor groups annually between 2002 and 2018, and broke them down as being headquartered in either the United States or the Rest of the World. Active investors are categorized either as “new” (founded that year) or “existing” (founded prior to that year and made at least one investment in the three years prior).
The first three charts here show the active number of firms by year by investor type, activity status (exiting or new), and the new firm share of total.

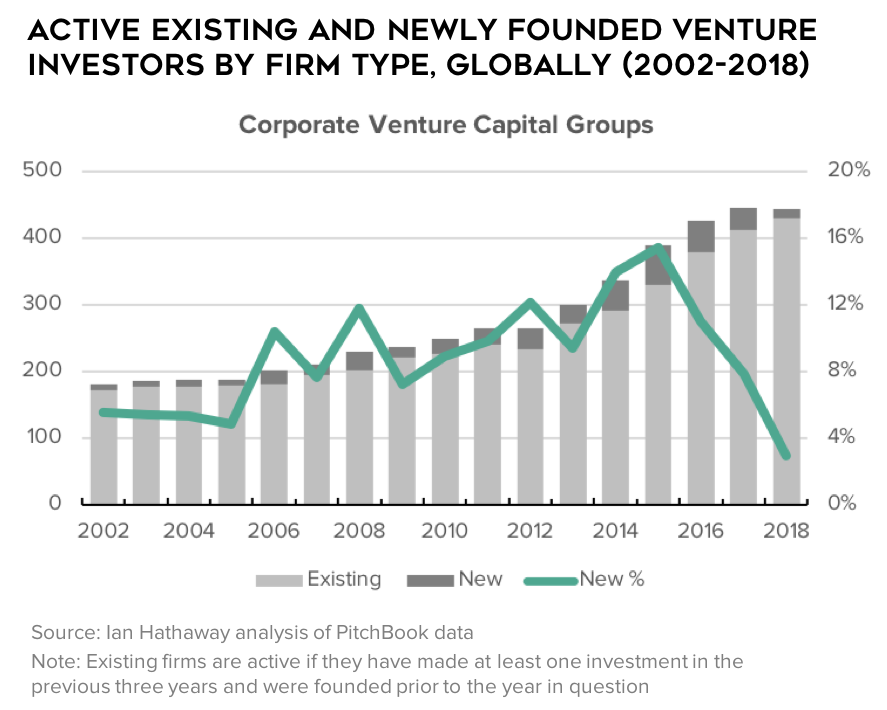

For all three groups, we see a remarkable rise in the number of active firms, with the sharpest rises coming from corporate venture capital and the broad accelerator and incubator group. Venture capital firms increased in a straight linear fashion, and they are about 2.5 the number of active firms today as in 2002. Corporate venture firms have seen a rise of a similar magnitude, and accelerators and incubators are now at about a factor of 8 compared with the beginning of the period.
The new firm share of global venture capital firms raised from around 6 or 7 percent in the mid-2000s to 10 or 11 percent in the first part of this decade before collapsing after 2015. Accelerators and incubators increased from around 8 percent to as high as 24 percent before tailing off the last few years, and CVCs meanwhile expanded the most—increasing their new firm share from 3 to 4 percent to as high as 15 percent. The stock of existing firms is so much larger for venture capital that it masks the sizable growth in activity over the period, compared with the others.
The sheer collapse of new firms across all three groups is stunning. I have no doubt that there has been a major pullback in the number of these firms being launched in recent years, however I suspect the numbers will increase some with time—venture founding events frequently come with time lags in venture capital databases. But, it won’t change that much—the substantial and continued rise of new venture capital firms, accelerators and incubators, and CVCs is over, or it is at least on hold.
What’s also interesting to me is the resiliency of firms in the sector once launched. Even in spite of the massive growth of new firms, we see that they still make up a small share overall—and even when the growth of new activity slowed, the overall level of active firms (the “stock”) stays more or less the same. This of course varies across the groups (VC firms are the most resilient, accelerators and incubators are the least), and of course, the overall levels will come down some with time.
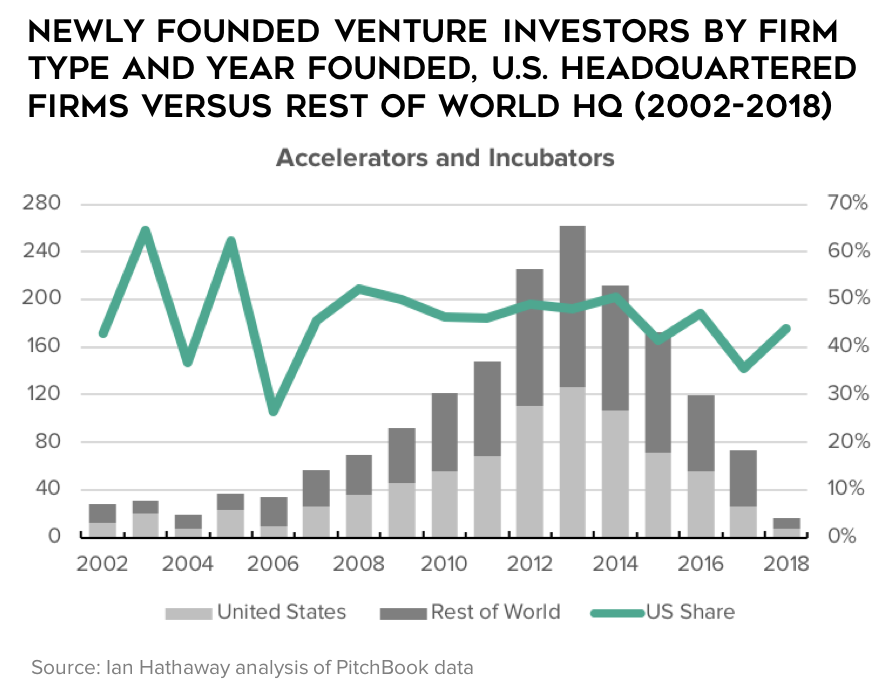
Next, let’s look at the distribution of new investor formation by geography—comparing firms headquartered in the U.S. versus those in other countries. The charts below show the number of new firms by firm type, broken down by either geographic group, and the share of new firms that are HQ’d in the US.
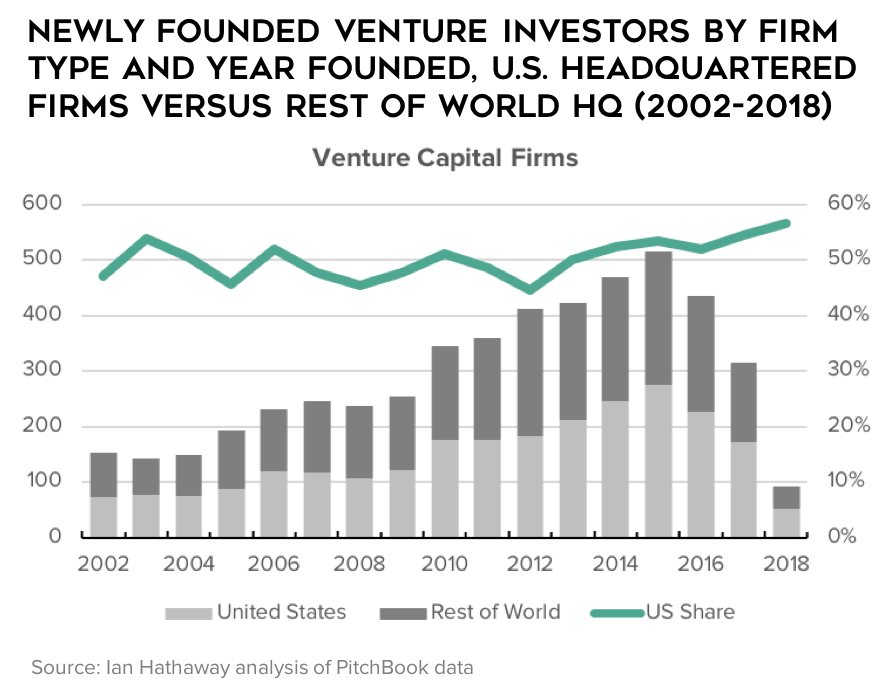
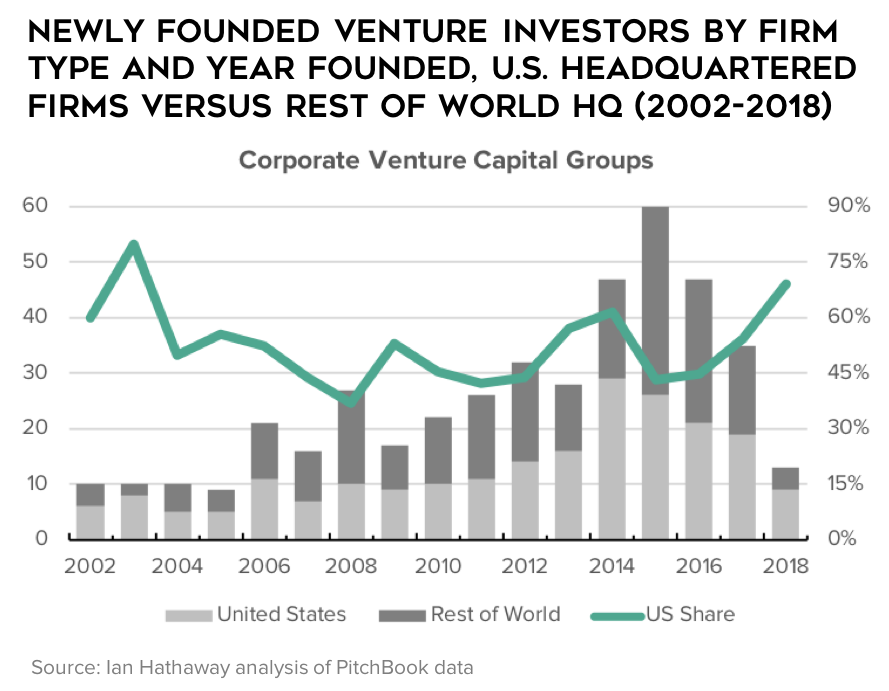
The charts tell two stories. First, we see that the Rest of the World launched new venture capital firms and corporate venture groups at a similar and at times faster pace than the United States did for much of the period, that changed dramatically after 2012 (VCs) and 2015 (CVCs) when the U.S. headquartered share spikes. This is interesting because, as documented in Rise of the Global Startup City, most of the growth in venture capital deals came from outside of the U.S. the last half decade.
Second, we see that the opposite occurred for accelerators and incubators, which grew more outside of the U.S. than inside of it since about 2008. Unfortunately for this group, we can’t break it down between accelerators and incubators (these are vastly different things, as I wrote about here and here), but this is an interesting and useful data trend no less.
To close, although not shown here, the rise of new firm activity among venture capital firms and corporate venture arms—though significantly elevated in recent years compared with a decade ago—is nowhere near what it was at the height of the dotcom boom. The new firm share of VC firms was 18 percent in 2000 and 28 percent for CVCs in the same year! Accelerators and incubators are really a thing of the recent past, so the results are different. So, in the context of that broader history, we’re at much more subdued levels of new firm entrants.